
Mastering Earned Value Management: A Simple Approach to Tracking Project Progress
September 29, 2024 · 12 min read
Earned Value Management (EVM), also known as the Earned Value Analysis (EVA), is a powerful project management tool that enables teams to measure project performance and progress in an objective manner. By integrating scope, time, and cost variables, EVM allows project managers to track how well a project is adhering to its planned schedule and budget. In this article, we’ll explore what is earned value analysis, the problems it solves, the essential metrics and indicators it uses.
What is Earned Value Management?
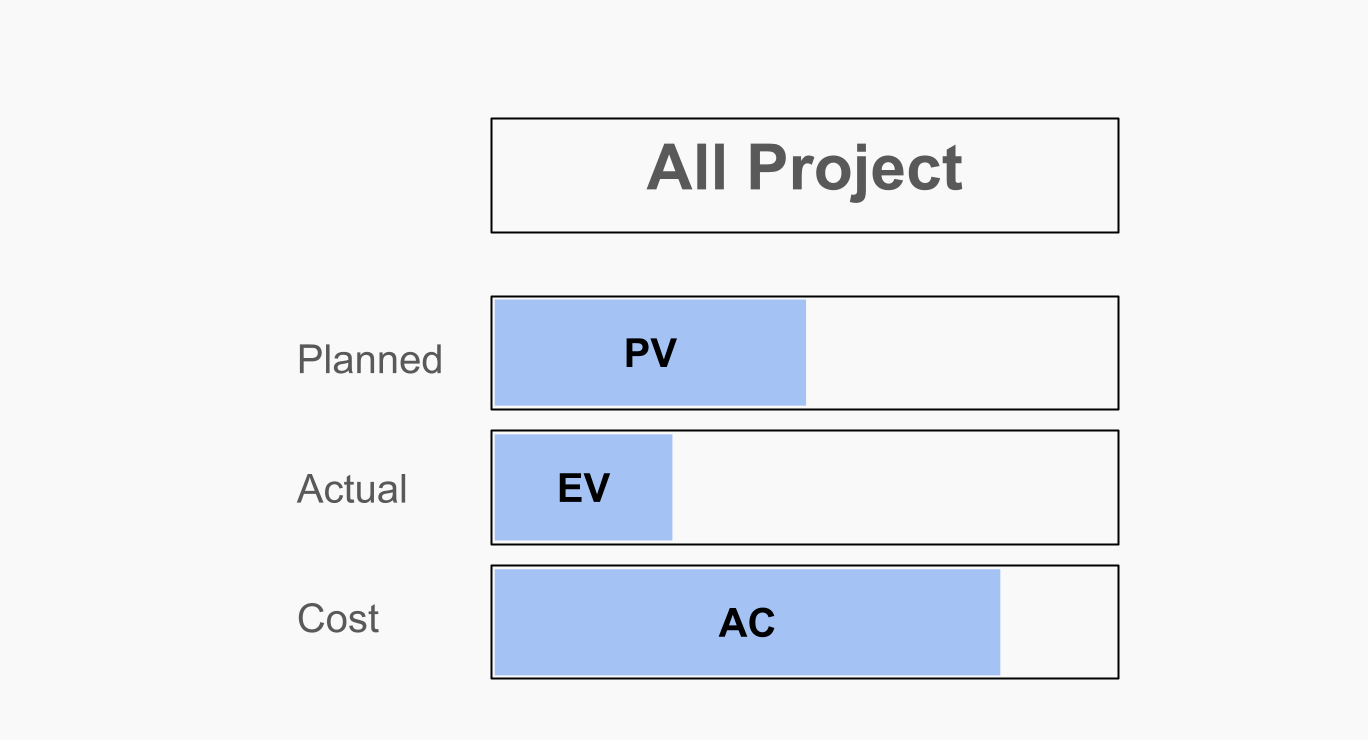
Earned Value Management (EVM) is a project management technique that combines three key dimensions of any project: the planned value (PV), the actual costs incurred (AC), and the value of the work actually completed (earned value, or EV). It provides a comprehensive view of project performance by comparing planned and actual progress, both in terms of time and cost.
What Problem Does EVM Solve?
At its core, EVM helps project managers answer the main question when tracking project progress: Are we on schedule and within budget? Traditional project management techniques often fall short of providing an accurate picture of performance, especially when it comes to managing complex, multifaceted projects. EVM solves this problem by offering a quantitative approach to project tracking that allows managers to predict potential cost overruns or schedule delays early on, thereby enabling timely interventions.
How to Calculate Earned Value: The Three Core Metrics
 EVM revolves around three core metrics that lay the foundation for measuring project progress:
- Planned Value (PV). PV represents the amount of work that should have been completed by a certain date, according to the project plan. It's like asking, "By today, how much money should we have spent based on our planned tasks?"
- Earned Value (EV). EV shows how much work has actually been completed. In financial terms, this is the value of the tasks you’ve finished, calculated based on the budget.
- Actual Cost (AC). AC is how much you've spent to achieve the work done so far. This metric includes all real expenses, such as labor, materials, and overhead costs.
The Four Main Performance Indicators
To make sense of the core metrics, EVM uses four key performance indicators (KPIs) to evaluate the current state of a project:
1. Schedule Performance
Schedule Performance Index (SPI)
The SPI compares the planned progress with the actual progress. It’s calculated as:
SPI = EV / PV
An SPI greater than 1 means the project is ahead of schedule, while an SPI less than 1 indicates delays.
Schedule Variance (SV)
SV is the difference between planned and actual performance in monetary terms:
SV = EV - PV
A positive SV means you're ahead of schedule, while a negative SV means you're falling behind.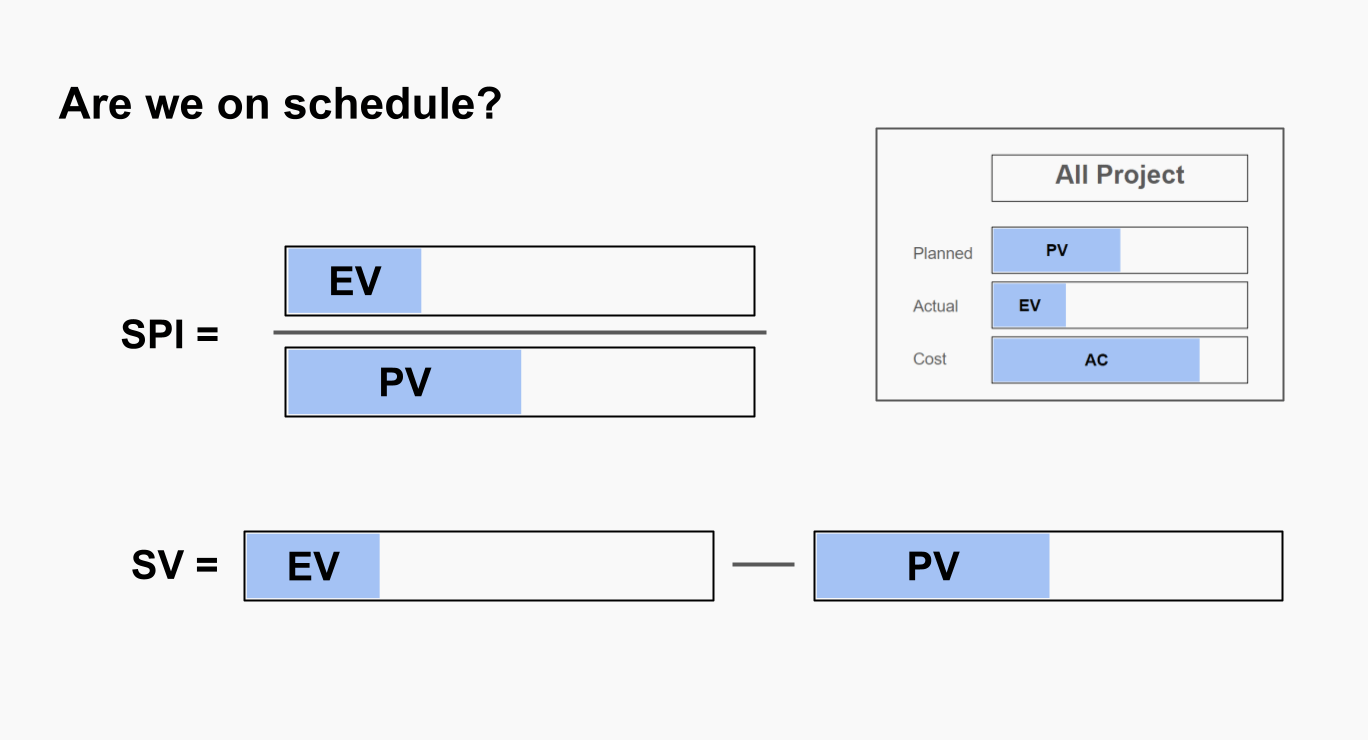
2. Cost Performance
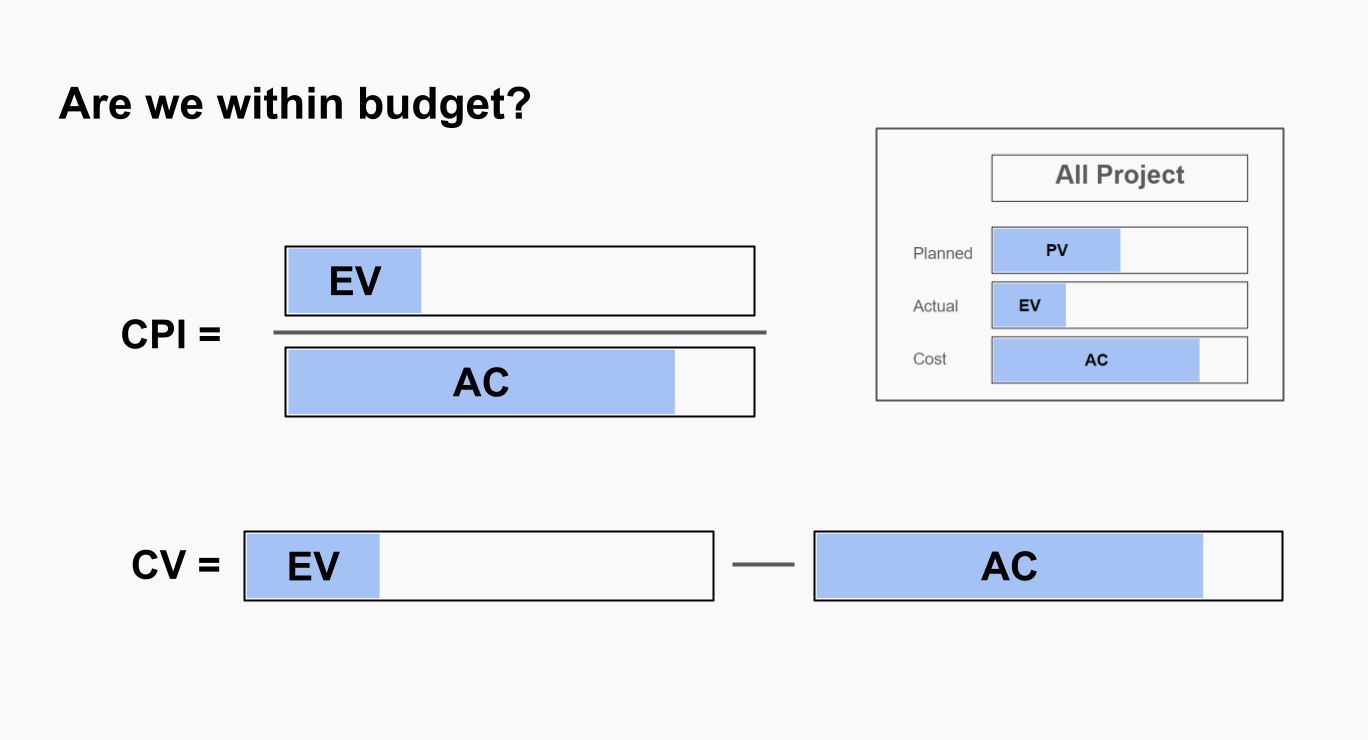
Cost Performance Index (CPI)
The CPI measures cost efficiency by comparing the value of work completed (EV) with what was actually spent (AC):
CPI = EV / AC
A CPI greater than 1 indicates that the project is under budget, while a CPI less than 1 means it is over budget.
Cost Variance (CV)
CV is the monetary difference between the earned value and actual cost:
CV = EV - AC
A positive CV suggests the project is under budget, whereas a negative CV indicates a cost overrun.
Why use both Performance Index and Variance?
Performance Index gives you a relative measure (a ratio), while Variance shows an absolute value. Together, they provide a more complete picture of schedule performance.
Earned Value Analysis Example
Let’s break down how to make earned value calculation of the basic EVM metrics step-by-step:
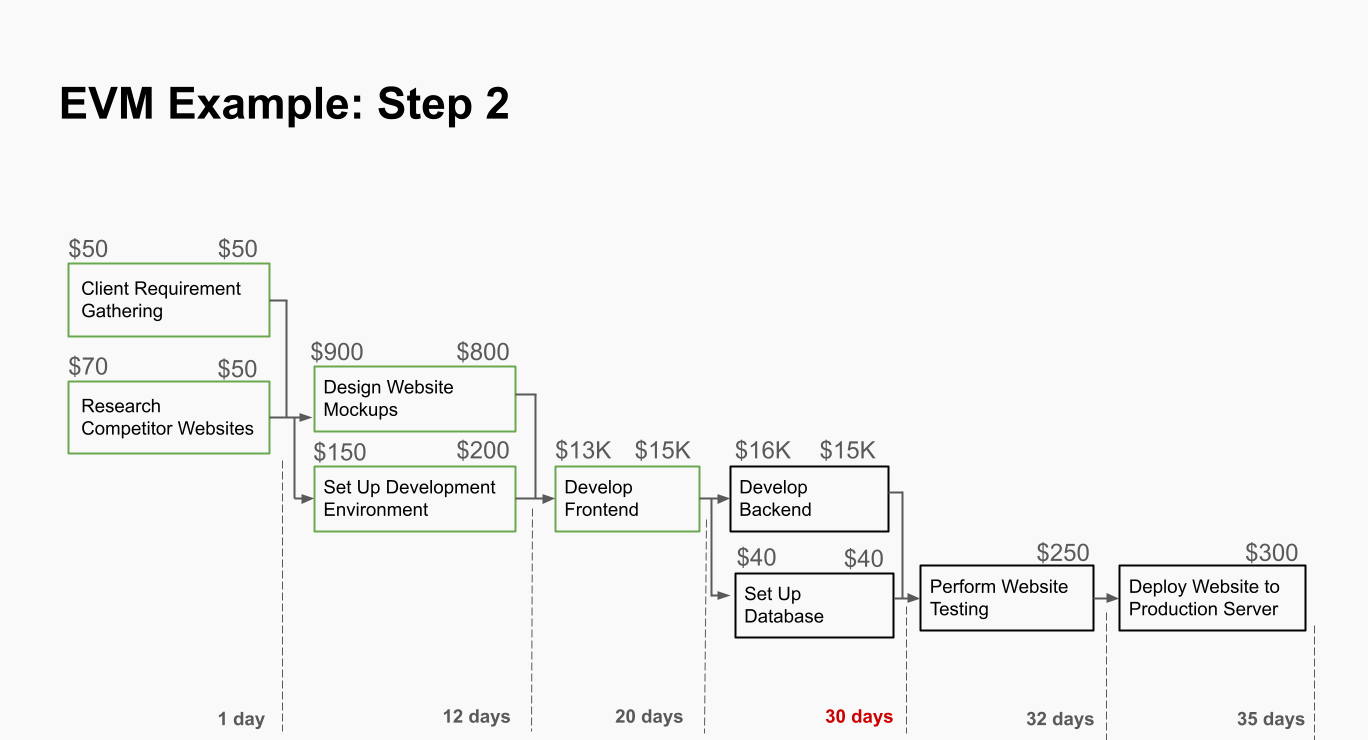
- Step 1. In the diagram below, you’ll see the workflow we'll use for our calculations. Each block represents a work item, with the planned value shown on the right above each item.
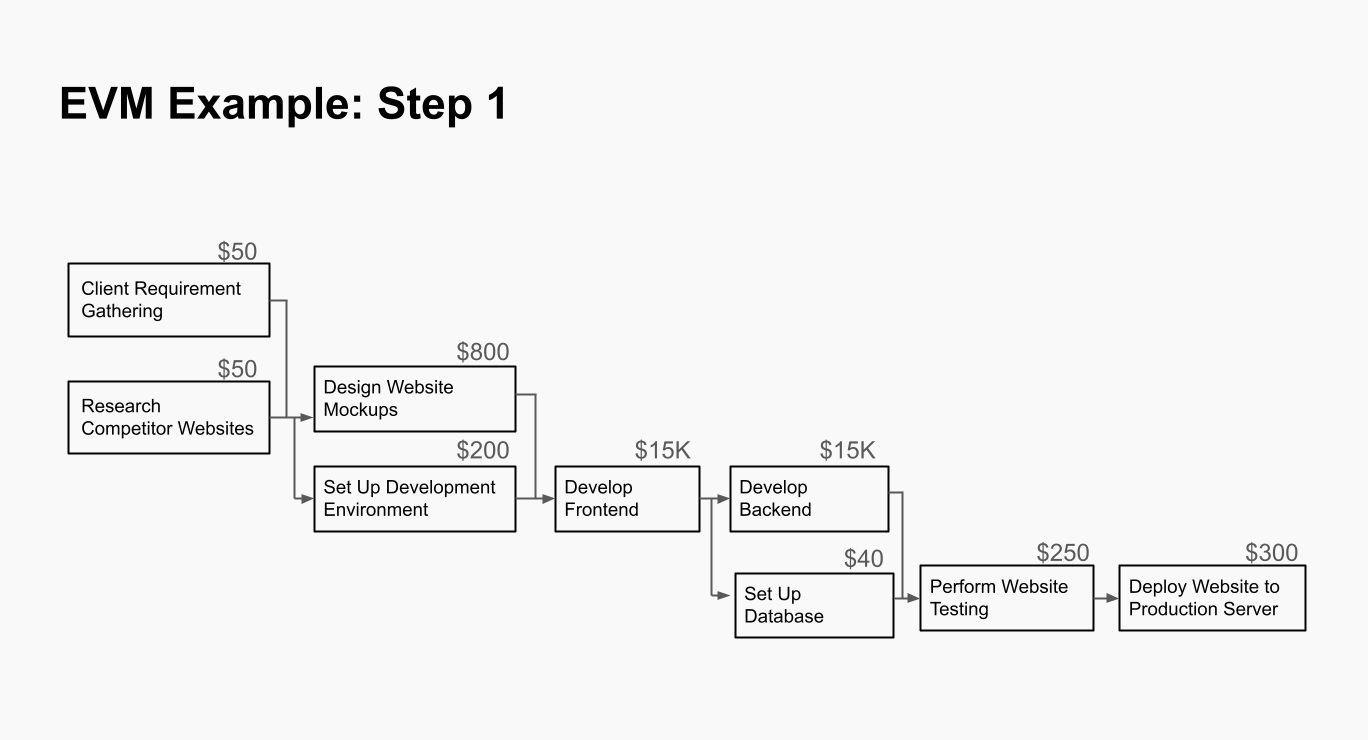
- Step 2. Now, we need to define the point where we’ll perform the calculations for the current project stage (30 days). We’ve added another set of numbers on the left, showing the actual cost of each work item so far. Completed work items are highlighted with a green frame, while unfinished items are left unframed.
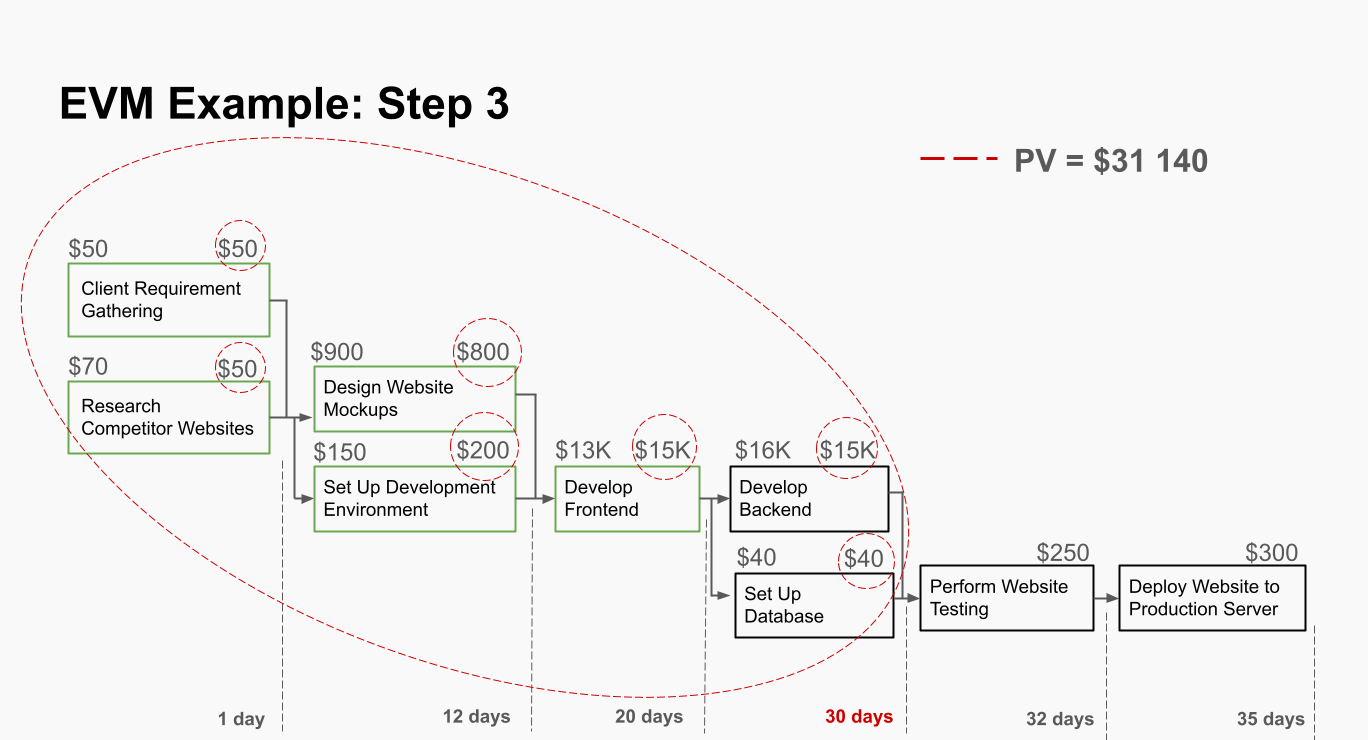
- Step 3. Next, we calculate the Planned Value (PV). To do this, sum the numbers on the right for all the work items that were scheduled to be completed by this point in time.
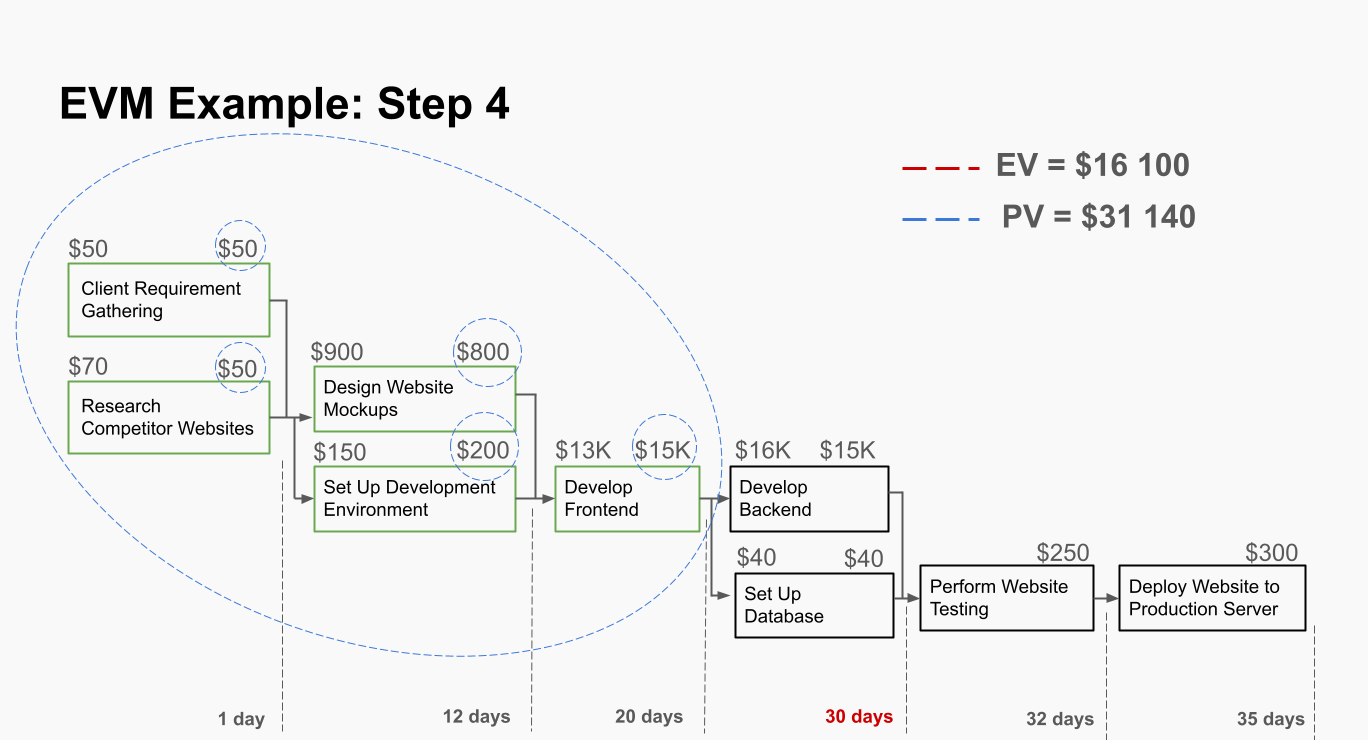
- Step 4. Now, let’s calculate the Earned Value (EV). This is done by summing the planned costs (the numbers on the right) for only the completed work items.
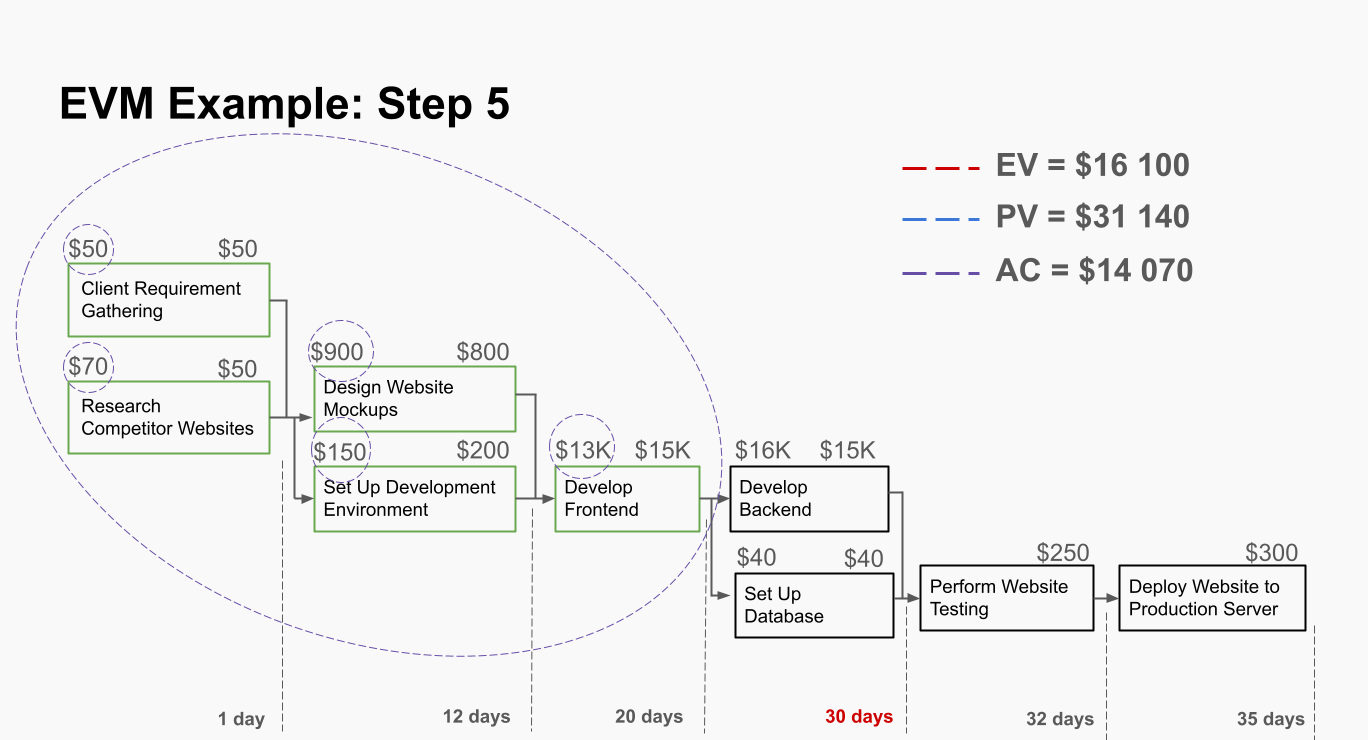
- Step 5. Lastly, let’s calculate the Actual Cost (AC). Here, sum the numbers on the left, which represent the actual costs incurred for completed work. Any work items still in progress are excluded, as their final cost may change.
Tip. You might wonder, “What if the incomplete work items in progress represent a significant part of the budget, and we’re not accounting for them?” The best solution is to break down large tasks into smaller, manageable pieces to improve visibility and control.
Additional Indicators: Other Earned Value Management Formulas
One of the greatest strengths of EVM is its flexibility. At its simplest, using just the three basic metrics (PV, EV, and AC) can give you an instant view of how well your project is progressing. But if you wish to see more, you can explore other metrics to get a more detailed picture. Some of the most popular EVM formulas are:
- Budget at Completion (BAC). The total planned budget for the entire project. Formula: BAC = Project Budget
- Estimate at Completion (EAC). The forecasted total cost of the project at completion. Formula: EAC = BAC / CPI
- Estimate to Complete (ETC). The expected cost to complete the remaining work. Formula: ETC = EAC – AC
- Variance at Completion (VAC). The difference between the total budget and the expected cost. Formula: VAC = BAC – EAC
- To-Complete Performance Index (TCPI). The cost performance required to complete the remaining work within the given budget. Formula: TCPI = (BAC – EV) / (BAC – AC) or (BAC – EV) / (EAC – AC)
The Key Challenge: Knowing Your Costs
While EVM is incredibly useful, its effectiveness hinges on one critical factor: accurate cost tracking. EVM requires precise, up-to-date cost data to provide meaningful insights. Incomplete or inaccurate cost data will skew the analysis and lead to misleading conclusions. For this reason, effective cost management systems and rigorous financial controls are essential for successful EVM implementation.
Conclusion
Earned Value Management system is a powerful and versatile method for tracking project performance. By focusing on just a few core metrics—Planned Value, Earned Value, and Actual Cost—you can get a clear and immediate picture of your project’s health. While the method requires accurate cost tracking, its ability to simplify communication and provide clear, actionable insights makes Earned Value Analysis in project management invaluable.
About the Author
Violetta Chernobuk is a skilled content strategist and writer at Planyway, specializing in crafting insightful and engaging articles on productivity and project management. With her keen eye for detail and a deep understanding of user needs, Violetta ensures that every piece of content is both informative and inspiring, helping readers optimize their workflows and stay ahead in their projects.
