
How To Create A Good Pert Chart. Definition, Examples and Template
June 20, 2024 · 10 min read
Managing large-scale projects often involves navigating a web of complex tasks and dependencies. A PERT chart is a valuable project management tool designed to simplify this complexity. Dive into the article below to learn how PERT charts help schedule, organize, and coordinate tasks, ensuring projects stay on track.
What is a Pert Chart?
A PERT (Program Evaluation and Review Technique) chart is a project management tool used to schedule, organize, and coordinate tasks within a project. Developed by the U.S. Navy in the 1950s, PERT charts are particularly useful for managing complex projects with many interdependent activities.
PERT Chart Symbols
To fully utilize a PERT chart, you should understand the symbols and their meanings.
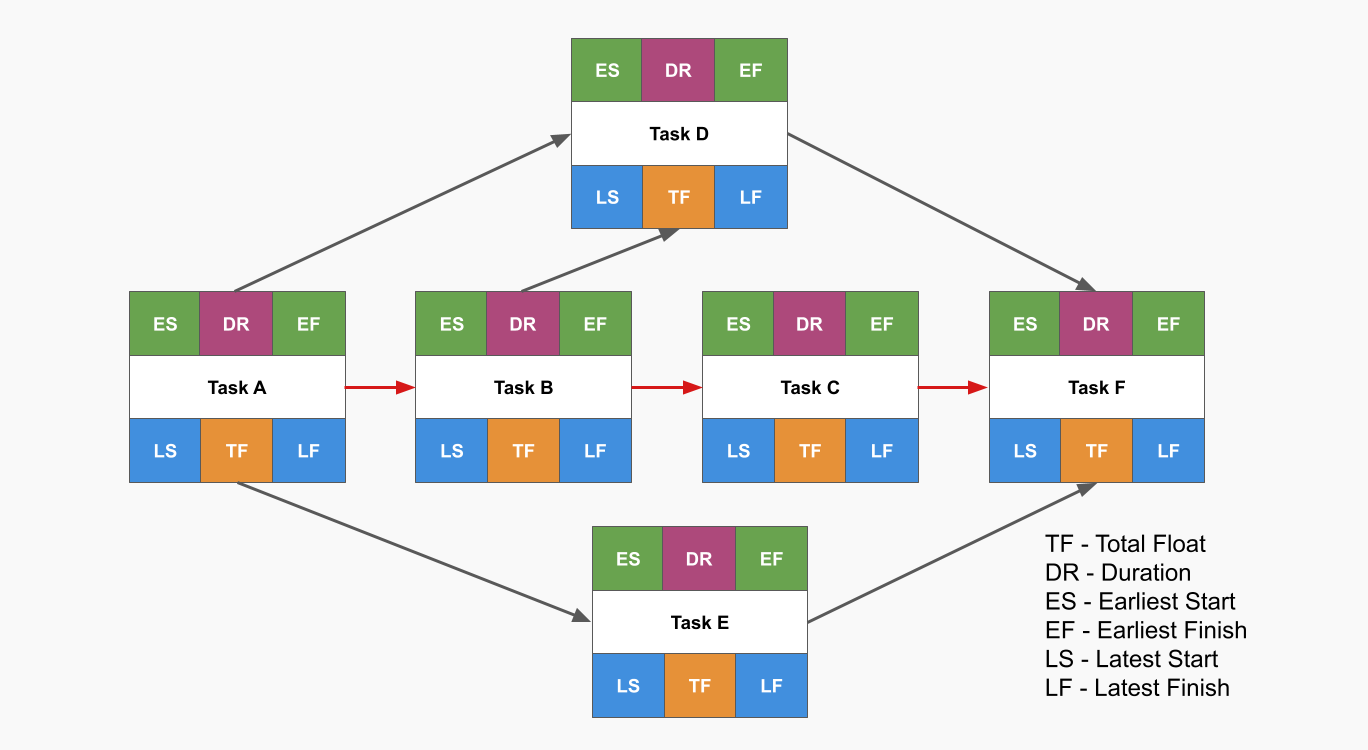
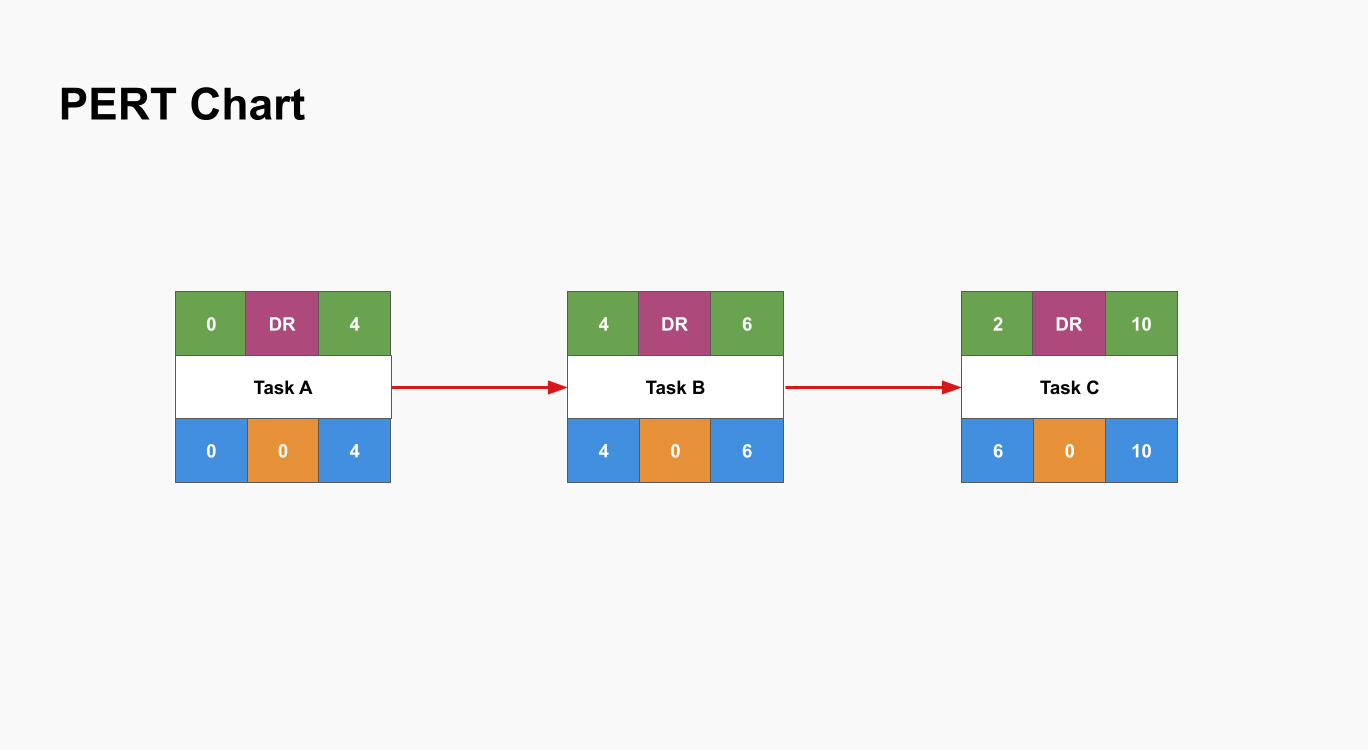
- Nodes (or Events): Represent milestones or events. These are often depicted as circles or rectangles (⬤ or ⬛). Each node is usually numbered and signifies the completion of one or more activities.
- Arrows (or Activities): Represent the tasks or activities that need to be completed. These are shown as arrows connecting the nodes (→). The direction of the arrow indicates the sequence of activities.
- Dotted Arrows (or Dummy Activities): Represent dependencies between tasks that do not require any time or resources. These are typically depicted as dashed arrows and are used to maintain the logical relationships between activities ( - - - - >).
- Labels on Arrows: Indicate the name or description of the activity and often include the estimated duration of the task.
- Start and End Nodes: Special nodes that signify the beginning and end of the project. These nodes are sometimes highlighted or uniquely shaped to distinguish them from other nodes (🟢 and 🔴).
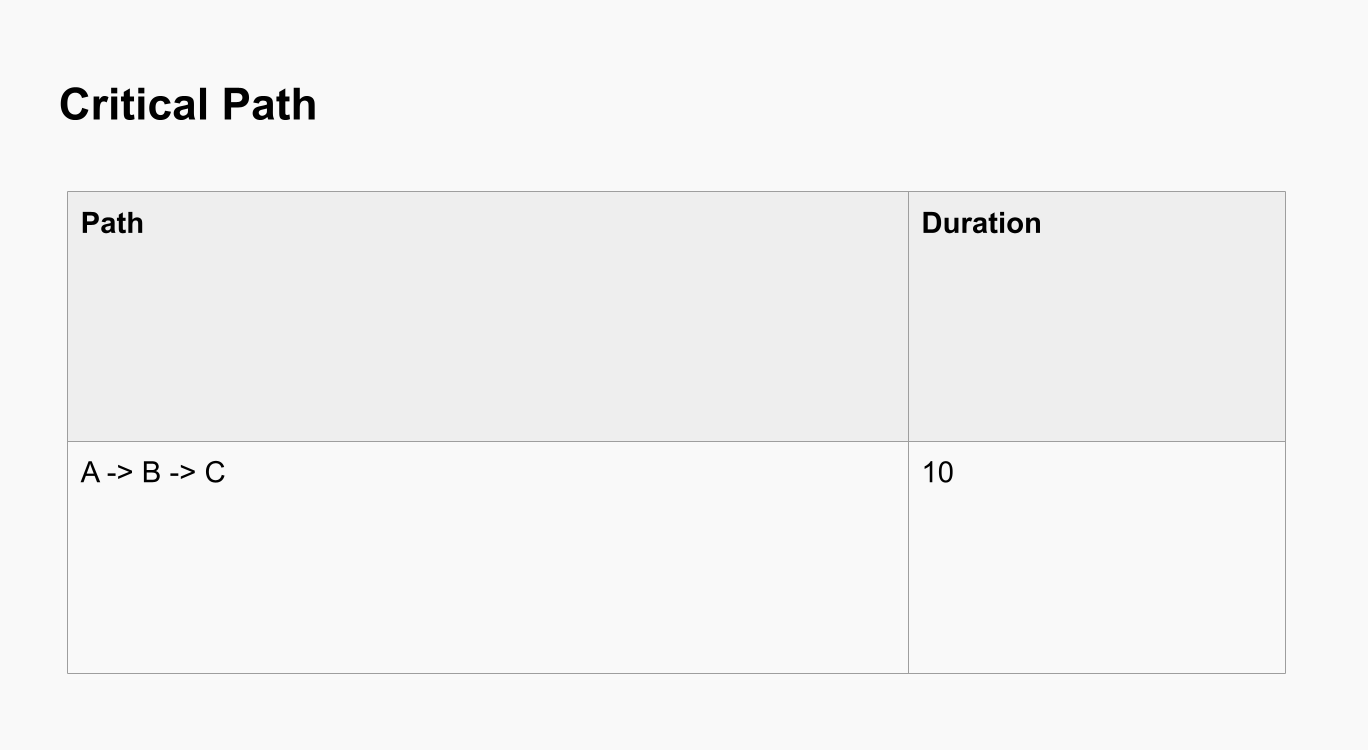
- Critical Path: The sequence of dependent tasks that determine the minimum project duration. These activities have zero slack time. In some PERT charts, the critical path is highlighted or shown with a different color or line style.
How a PERT Chart Works
Developing a PERT chart involves a series of systematic steps to ensure a thorough and accurate representation of the project’s tasks and dependencies. Here are the key steps used in developing a PERT chart:
Identify Tasks and Activities
List all tasks and activities required to complete the project. This includes breaking down the project into manageable components or work packages.
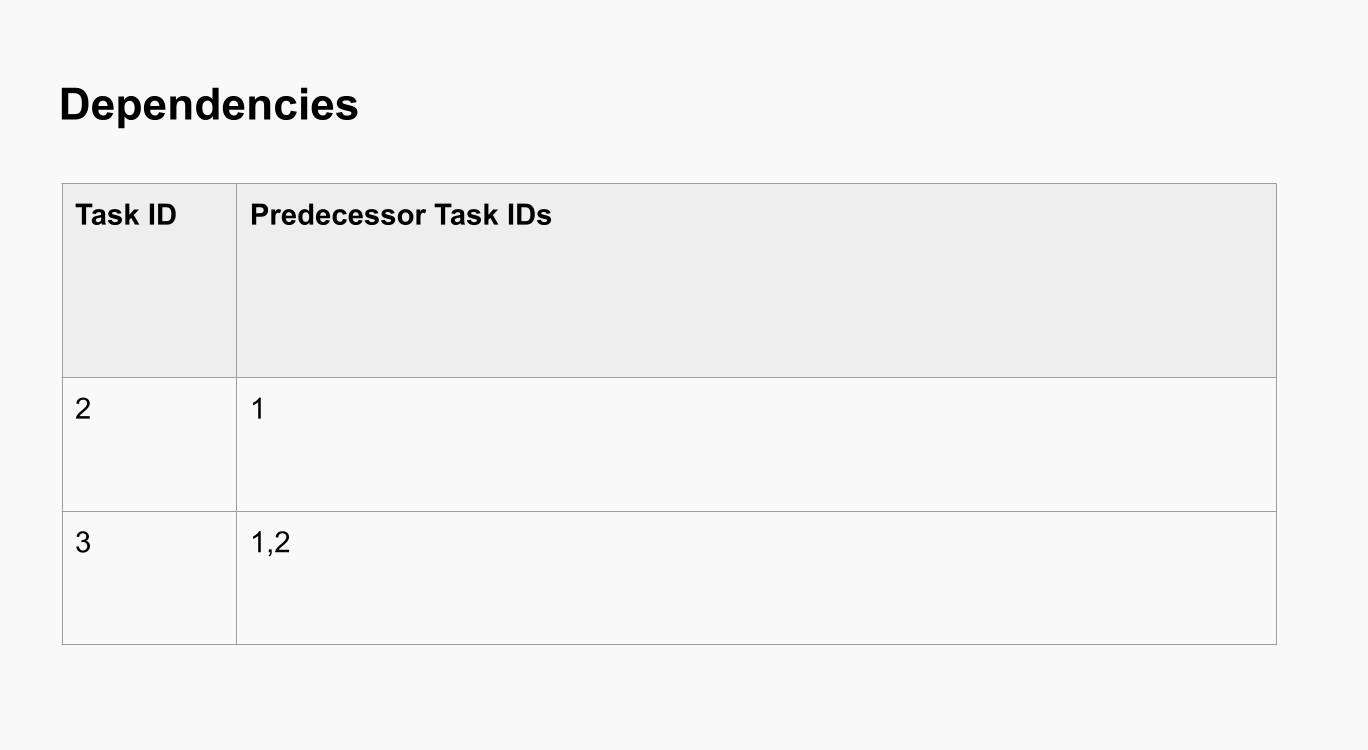
Determine Task Dependencies
Establish the relationships between tasks. Determine which tasks depend on the completion of others before they can start. This involves identifying predecessor and successor tasks.
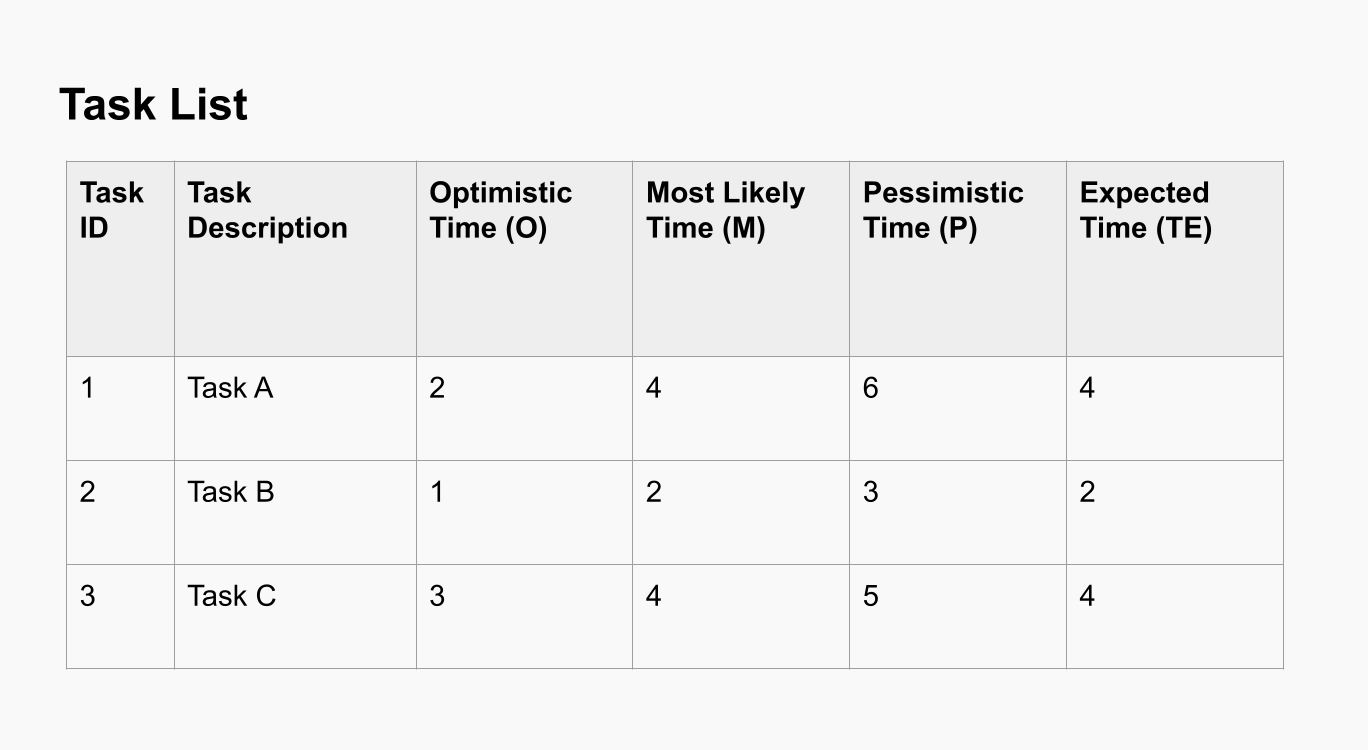
Estimate Task Durations
Estimate the time required for each task using three time estimates:
- Optimistic time (O): The shortest time in which the task can be completed.
- Pessimistic time (P): The longest time the task might take.
- Most likely time (M): The best estimate of the time required to complete the task under normal conditions.
Calculate the expected time (TE) for each task using the formula: TE=O+4M+P6TE = \frac{O + 4M + P}{6}TE=6O+4M+P
If you'd like to learn more about the techniques of task estimation, read our latest article.
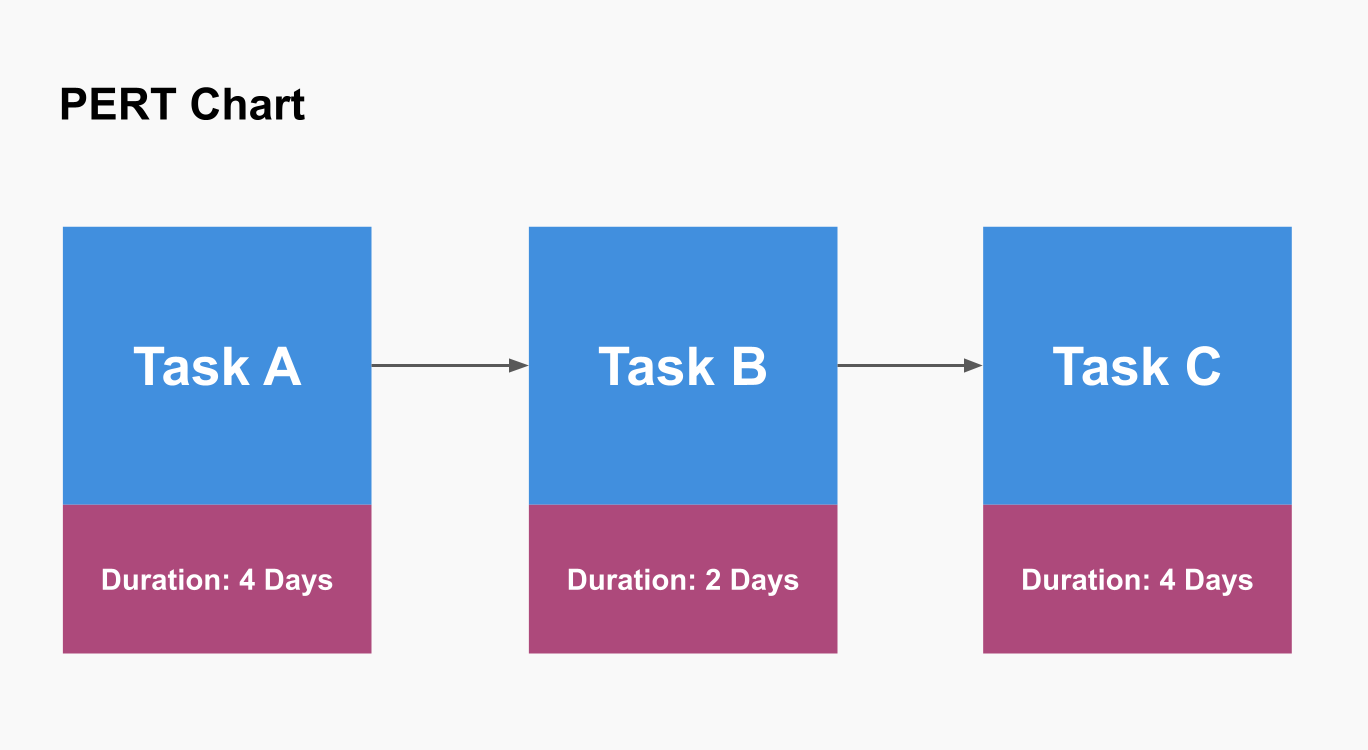
Draw the PERT Chart
Create a network diagram with nodes representing tasks and arrows showing dependencies like in the PERT chart examples below. Nodes are typically circles or rectangles, and arrows indicate the sequence and dependencies between tasks.
Identify the Critical Path
Determine the longest path through the network diagram from the start to the finish node. The critical path represents the minimum project duration and identifies tasks that cannot be delayed without affecting the project’s completion date.
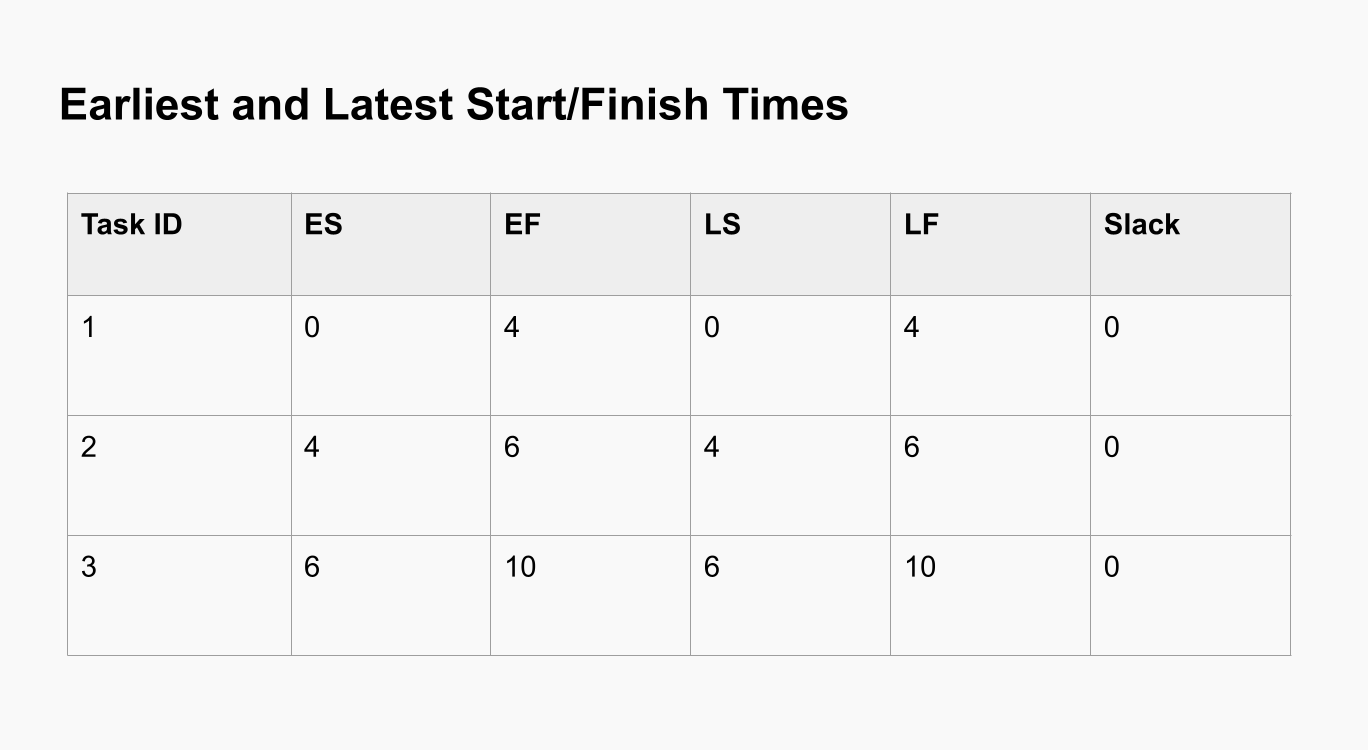
Calculate Earliest and Latest Start and Finish Times
Calculate the earliest start (ES) and earliest finish (EF) times for each task by performing a forward pass through the network diagram.
Calculate the latest start (LS) and latest finish (LF) times for each task by performing a backward pass through the network diagram.
Determine Slack/Float Times
Calculate the slack or float time for each task, which is the amount of time a task can be delayed without affecting the project’s completion date. Tasks on the critical path have zero slack.
Review and Optimize the Chart
Review the PERT chart for accuracy and completeness. Make adjustments as needed to reflect any changes in task durations or dependencies. Optimize the project schedule by exploring possibilities for parallel processing and resource allocation.
PERT Chart vs Gantt Chart
PERT charts and Gantt charts are both valuable tools in project management, but they serve different purposes and display different types of information. Here are some important pieces of information visible on a PERT chart that cannot be seen on a Gantt chart:
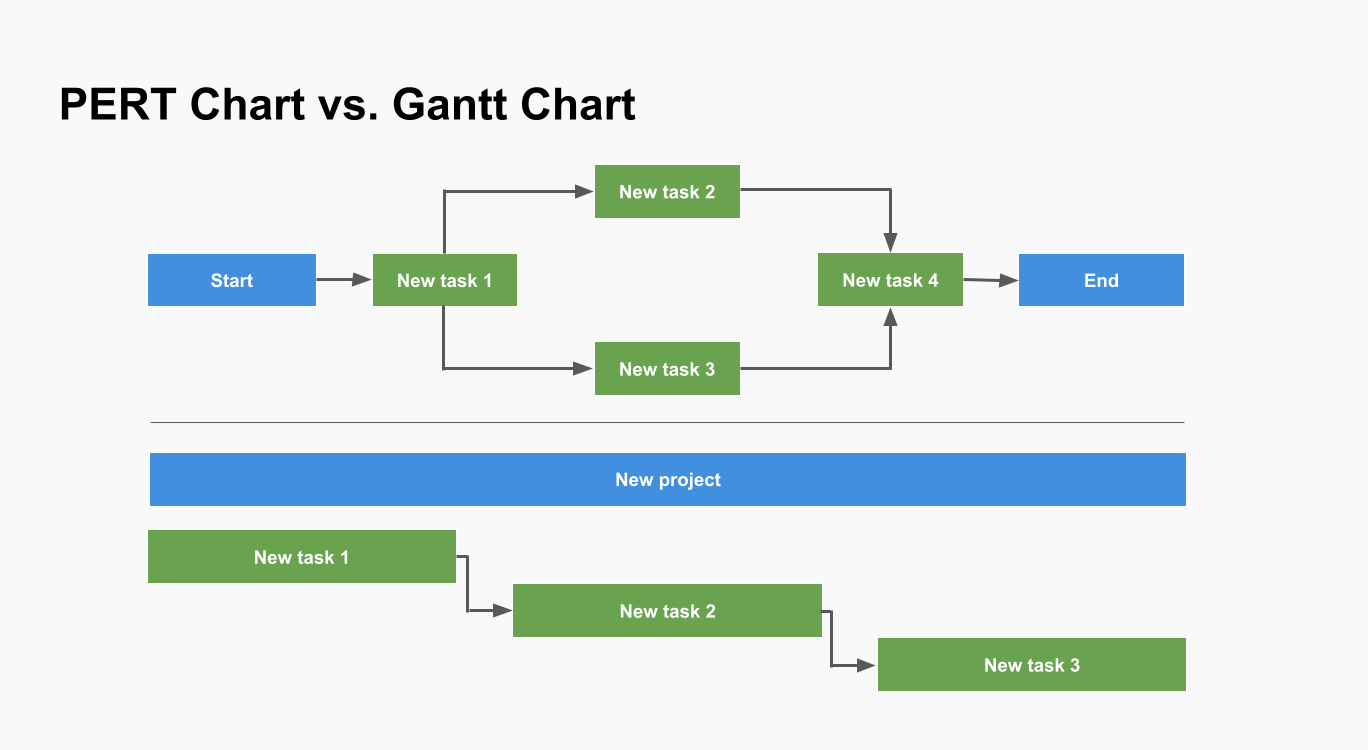
1. Task Dependencies and Relationships
- PERT Chart: PERT charts explicitly show the dependencies between tasks using arrows. This visual representation of task relationships makes it clear how tasks are interconnected and the sequence in which they must be performed.
- Gantt Chart: While Gantt charts can show dependencies, they primarily focus on the timing and duration of tasks. Dependencies are often indicated by lines connecting tasks, but this information is not as prominently or explicitly displayed as in a PERT chart.
2. Critical Path Identification
- PERT Chart: The critical path is explicitly highlighted in a PERT chart. It shows the longest path through the network and identifies the tasks that directly affect the project completion time.
- Gantt Chart: Gantt charts do not inherently display the critical path. While some advanced Gantt chart software can calculate and show the critical path, it is not a built-in feature of basic Gantt charts.
3. Probabilistic Time Estimates
- PERT Chart: PERT charts include probabilistic time estimates: optimistic, pessimistic, and most likely times for each task. This allows for the calculation of expected times and consideration of uncertainty in task durations.
- Gantt Chart: Gantt charts typically show a single duration estimate for each task, without accounting for variability or uncertainty in task durations.
4. Sequential and Parallel Activities
- PERT Chart: PERT charts clearly display which tasks can be performed in parallel and which must be performed sequentially. This helps in understanding the project's workflow and identifying opportunities for parallel processing to reduce project duration.
- Gantt Chart: Gantt charts can show overlapping tasks, but the focus is more on the schedule rather than the explicit parallelism of tasks.
5. Slack/Float Times
- PERT Chart: PERT charts can easily show the slack or float time for each task, indicating how much delay is permissible without affecting the overall project timeline.
- Gantt Chart: While Gantt charts can include slack time, it is not always prominently displayed or easy to interpret.
PERT vs CPM (Critical Path Method)
While both PERT and Critical Path Method are widely used for project scheduling and management and share similarities in their objectives and applications, they differ in their approaches, methodologies, and areas of strength:
- Time Estimation: PERT is best suited for projects with high uncertainty and variability in activity durations, while CPM is ideal for projects with well-defined and predictable tasks.
- Focus: PERT emphasizes time and flexibility, aiming to provide a realistic timeline by considering various scenarios. CPM focuses on optimizing both time and cost, making it more applicable for projects where cost control is crucial.
- Application: PERT is often used in research and development projects, defense projects, and other initiatives with high uncertainty. CPM is widely used in construction, engineering, and maintenance projects where tasks and costs are more predictable.
What is the Main Advantage of Using a Pert Chart on a Large Scale Project?
The main advantage of using a PERT chart on a large-scale project is its ability to handle complex task dependencies and project uncertainties effectively. Here are the key reasons why this is particularly beneficial for large-scale projects:
- Visualization of Complex Dependencies: Provides a clear view of task sequences and interrelations, aiding in the identification and management of critical tasks.
- Critical Path Analysis: Highlights the critical path, focusing on tasks that could delay the project if not completed on time.
- Handling Uncertainty: Uses three-time estimates (optimistic, pessimistic, most likely) for nuanced timeline analysis and risk anticipation.
- Improved Resource Allocation: Optimizes resource use by identifying dependencies and critical tasks.
- Enhanced Coordination: Serves as a communication tool for better project schedule overview and stakeholder alignment.
- Early Problem Detection: Detects potential delays early, allowing for proactive issue resolution.
- Effective Decision Making: Supports informed decisions with comprehensive data and critical path analysis.
Conclusion
A PERT chart is a powerful project management tool designed to handle the complexities and uncertainties inherent in large-scale projects. PERT charts offer a clear visualization of task dependencies, helping project managers understand and manage the sequence of activities effectively. They provide crucial insights into the critical path, which is vital for ensuring timely project completion by highlighting tasks that could delay the entire project if not managed properly.
Moreover, PERT charts accommodate uncertainty through probabilistic time estimates, offering a more nuanced analysis of project timelines and facilitating better risk management. This capability is particularly beneficial in large projects where variability in task durations is common. Additionally, PERT charts enhance resource allocation, improve coordination among teams, and enable early detection of potential delays, ensuring proactive problem-solving and smoother project execution.
About the Author
Violetta Chernobuk is a skilled content strategist and writer at Planyway, specializing in crafting insightful and engaging articles on productivity and project management. With her keen eye for detail and a deep understanding of user needs, Violetta ensures that every piece of content is both informative and inspiring, helping readers optimize their workflows and stay ahead in their projects.
